Getting Started
Redstrings is a visual relationship mapping tool that helps you connect ideas, people, organizations, and concepts. Think of it as a digital investigation board where you can pin cards and connect them with red strings.
Creating Your First Project
When you launch Redstrings, you'll see an empty canvas. To create a new project:
- Go to File → New Project (or press Ctrl+N / ⌘N)
- Choose a folder location for your project
- Your project files will be saved in a
.redstringsfolder

Opening Existing Projects
To open a project you've worked on before:
- Go to File → Open Project (or press Ctrl+O / ⌘O)
- Navigate to the folder containing your
.redstringsdirectory - Select the folder and click Open
Interface Overview
The Redstrings interface is designed to stay out of your way while giving you quick access to everything you need.
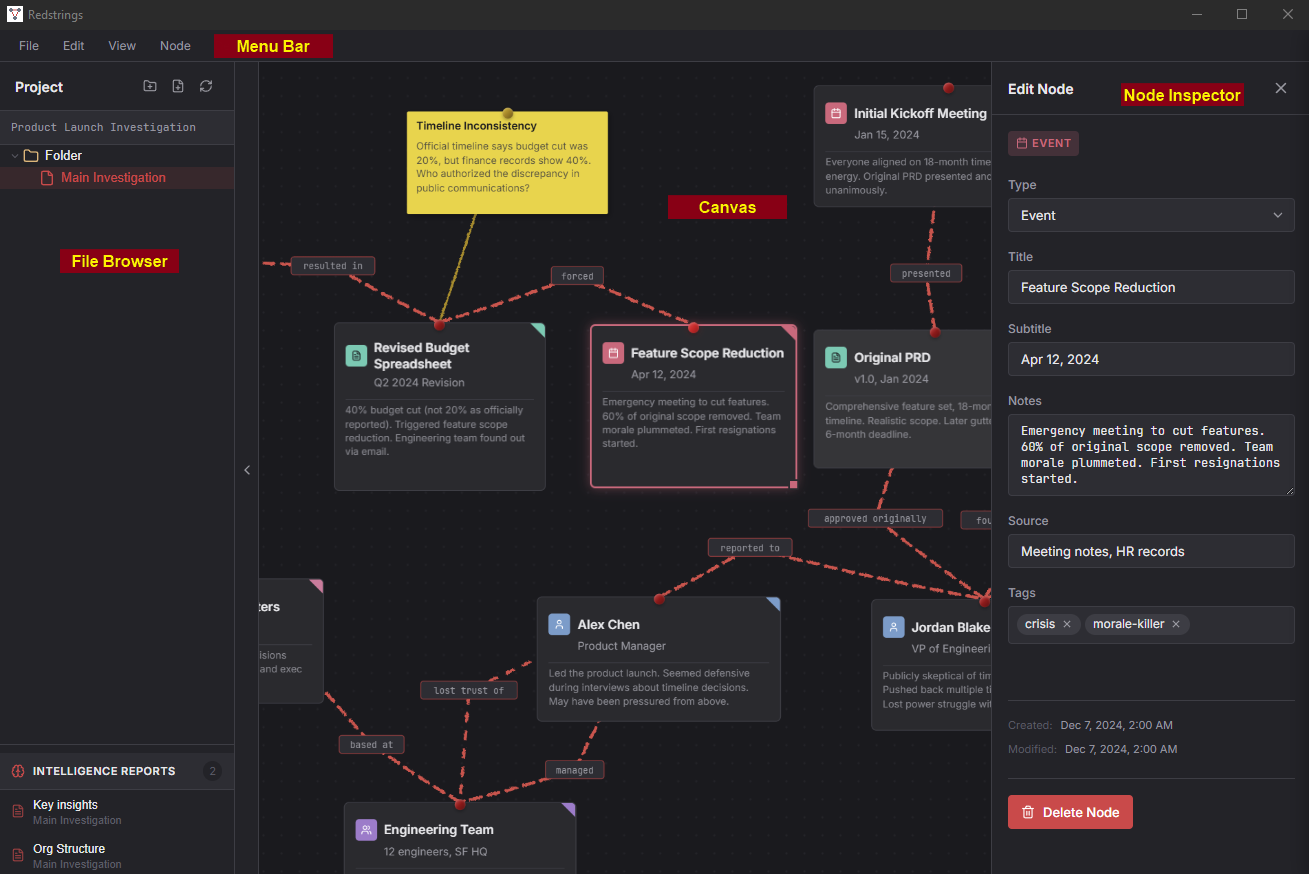
Key Areas
- Menu Bar - Access all commands and see keyboard shortcuts
- File Browser - Browse and manage your project boards (toggle with Ctrl+B / ⌘B)
- Canvas - Your main workspace where nodes and edges live
- Node Inspector - Edit the selected node's details (appears when a node is selected)
Working with Nodes
Nodes are the building blocks of your board. Each node represents a person, place, thing, event, or concept you want to track.
Adding Nodes
There are several ways to add a new node:
- Press N to open the Add Node dialog
- Double-click on the canvas
- Go to Node → Add Node in the menu
Selecting Nodes
- Click a node to select it
- Shift+Click to add to selection
- Click and drag on empty canvas to box-select multiple nodes
- Press Escape to deselect all
Moving Nodes
Click and drag any node to move it. Selected nodes will snap to a grid for clean alignment. Hold Alt while dragging to disable grid snapping.
Resizing Nodes
Drag the edges or corners of a selected node to resize it. Nodes have a minimum size but can grow as large as you need.

Tilting Nodes
For that authentic investigation board feel, you can tilt nodes slightly. With a node selected, use the rotation handle or adjust the tilt in the Node Inspector panel.
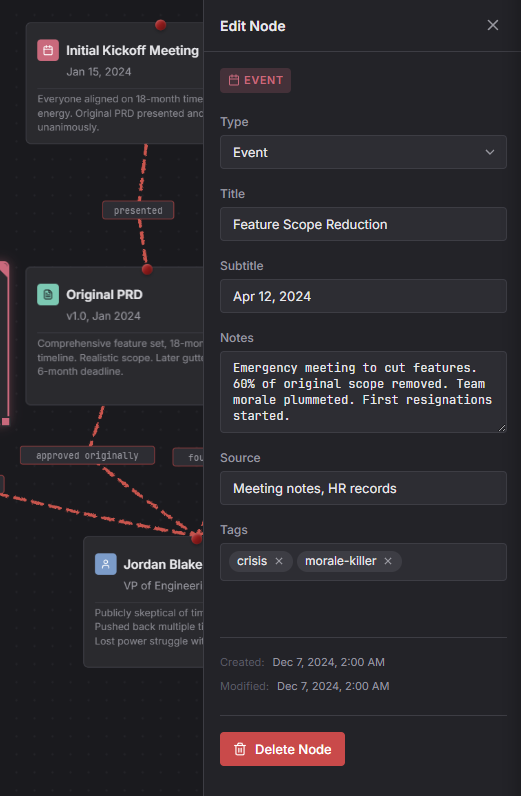
Editing Nodes
Double-click a node or select it and look at the Inspector panel on the right to edit:
- Title - The main label shown on the card
- Type - Choose from Person, Team, Artifact, etc.
- Description - Add detailed notes (supports markdown)
- Image - Add a photo or icon to the card
Deleting Nodes
Select one or more nodes and press Delete or Backspace. You'll be asked to confirm before nodes with connections are removed.
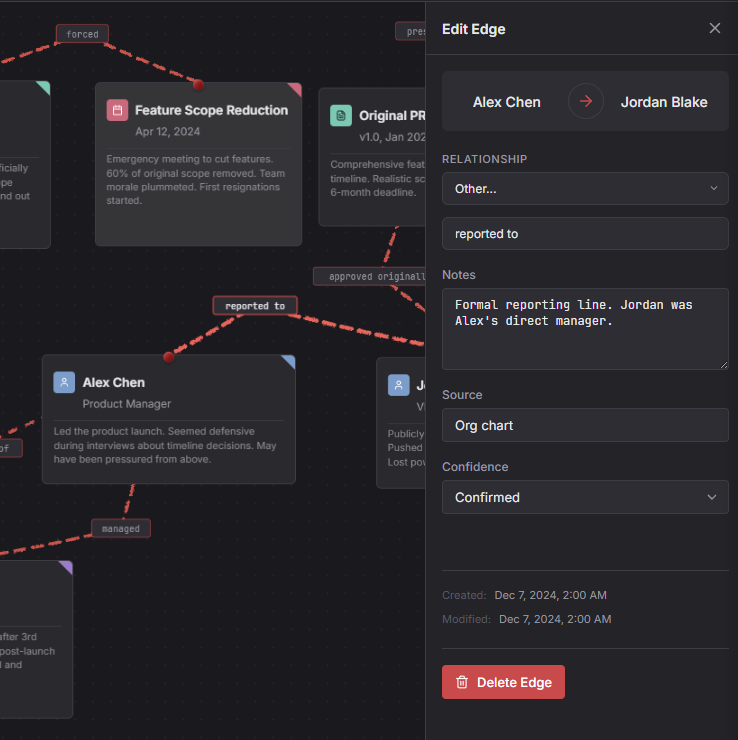
Connecting with Strings
Edges (the red strings) represent relationships between nodes. They're the connections that turn a collection of cards into a meaningful investigation board.
Creating Connections
- Select the source node
- Press E to open the Edge dialog
- Choose the target node from the dropdown
- Optionally add a label to describe the relationship
- Click Create
Quick method: You can also drag from one node's edge handle to another node to create a connection quickly.
Edge Labels
Labels appear along the string and describe the relationship. Examples:
- "reports to"
- "works with"
- "owns"
- "created"
- "mentioned in"
Deleting Edges
Click on an edge to select it, then press Delete. The nodes will remain; only the connection is removed.
Node Types
Each node has a type that determines its color. This helps you quickly identify what kind of entity you're looking at.
Custom Node Types (Pro)
With Redstrings Pro, you can create your own node types with custom colors and icons to match your specific workflow or investigation needs.
Canvas Navigation
The canvas is infinite - you can pan and zoom to work with boards of any size.
Panning
- Scroll - Pan up/down
- Shift+Scroll - Pan left/right
- Middle-click drag - Pan freely in any direction
Zooming
- Ctrl+Scroll / ⌘Scroll - Zoom in/out
- Ctrl+= / ⌘= - Zoom in
- Ctrl+- / ⌘- - Zoom out
- Ctrl+0 / ⌘0 - Zoom to fit all nodes

File Browser
The File Browser sidebar lets you manage multiple boards within a single project. Toggle it with Ctrl+B / ⌘B.
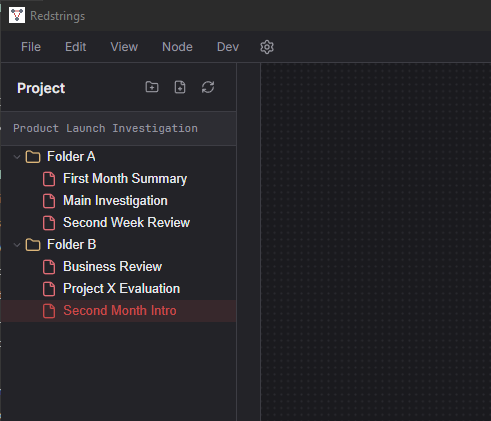
Creating New Boards
Right-click in the File Browser to create new boards within your project. Each board is saved as a separate file, letting you organize complex investigations into chapters.
Project Structure
Each board is saved as a .redstring file (JSON format). You can organize
boards into folders however you like. Images attached to nodes are embedded directly
in the board file.
Search
Press Ctrl+K / ⌘K to open the search palette. You can search for:
- Node titles
- Node descriptions
- Edge labels
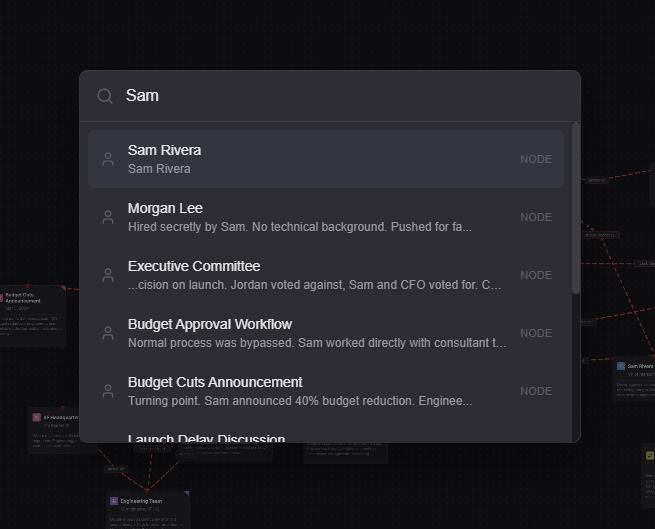
Click a result to select and zoom to that node on the canvas.
Exporting
Redstrings offers several export options for sharing and backup:
Save As / Export Board
Go to File → Export Project to save the current board as a standalone
.redstring file. This file contains:
- All nodes and their positions
- All edges (connections)
- AI analysis reports
- Board metadata and settings
You can share this file with others or use it as a backup. Recipients can open it directly in Redstrings.
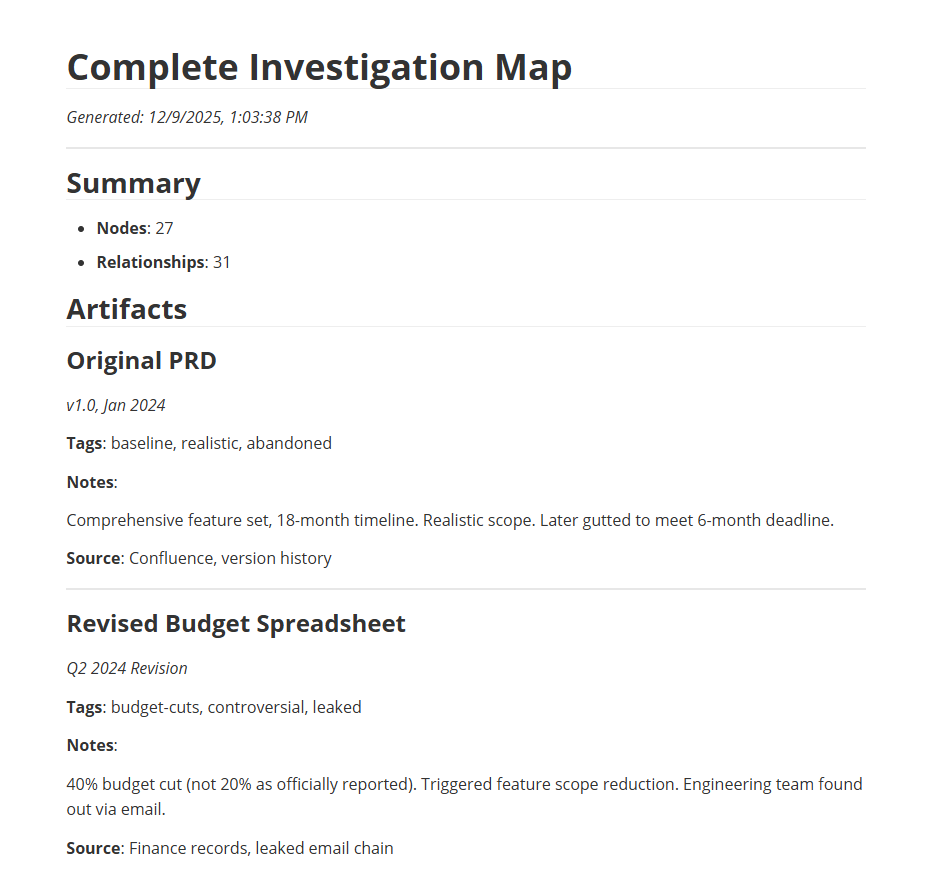
Export Markdown Report
Go to File → Export Markdown Report to generate a text-based report of the current board. The report includes:
- Summary with node and relationship counts
- All nodes grouped by type with their details
- A table of all relationships
Great for sharing findings with people who don't have Redstrings, or for creating documentation.
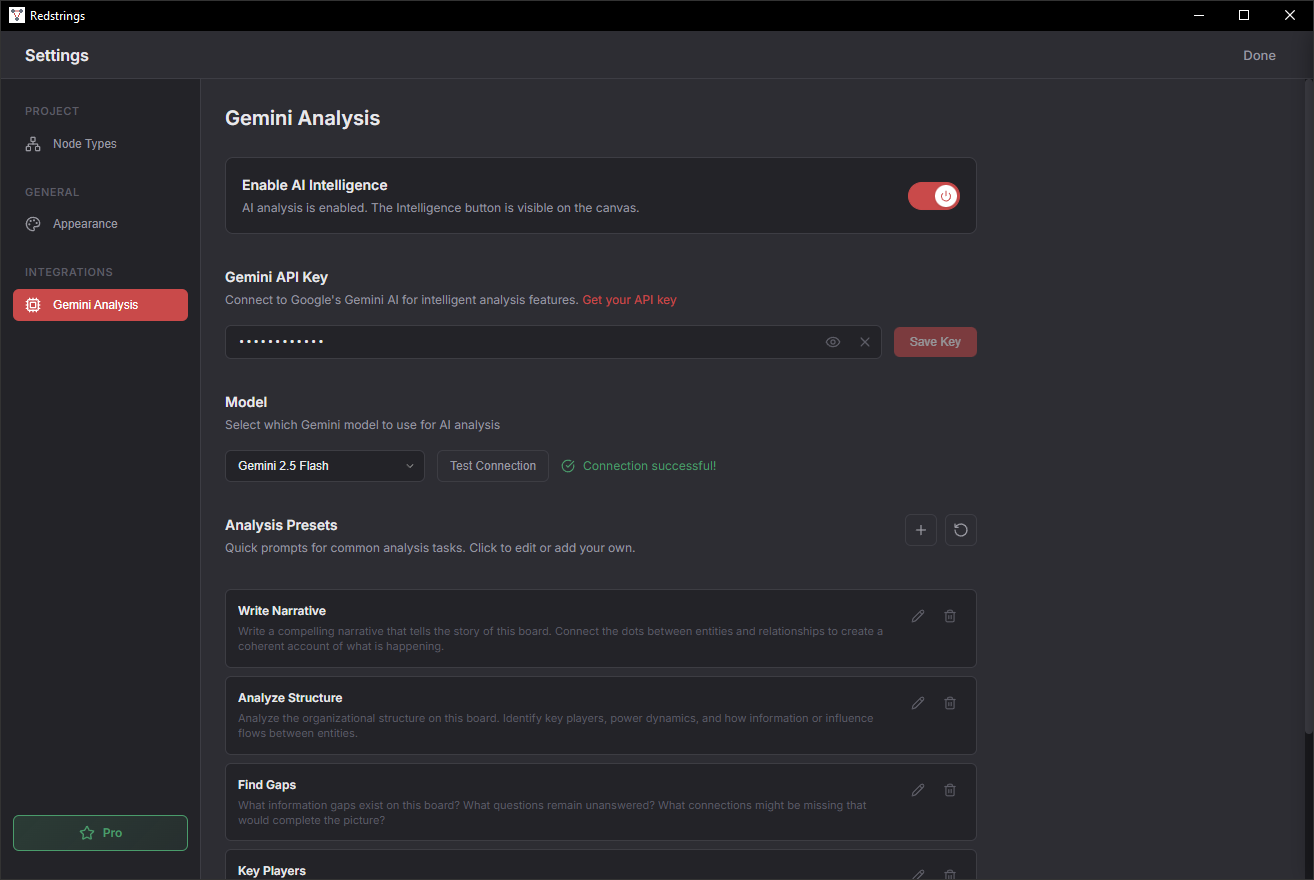
AI Analysis (Pro)
Redstrings Pro includes AI-powered analysis using Google's Gemini API. This feature uses a Bring Your Own Key (BYOK) model - you provide your own API key.
Setting Up
- Get a Gemini API key from Google AI Studio
- Go to Settings in Redstrings
- Enter your API key in the AI section
Using AI Analysis
Select one or more nodes and use the AI Analysis feature to:
- Summarize relationships
- Identify patterns
- Suggest missing connections
- Generate reports
Note: Your data is sent directly to Google's API. We never see your API key or your analysis content. Review Google's Gemini API Terms for how they handle data.
Keyboard Shortcuts
On macOS, use ⌘ (Command) instead of Ctrl.
General
| Ctrl+N / ⌘N | New project |
| Ctrl+O / ⌘O | Open project |
| Ctrl+Z / ⌘Z | Undo |
| Ctrl+Shift+Z / ⌘⇧Z | Redo |
| Ctrl+K / ⌘K | Search |
| Ctrl+, / ⌘, | Settings |
| Escape | Deselect / Close dialog |
Nodes & Edges
| N | Add new node |
| E | Add edge (with node selected) |
| Delete / Backspace | Delete selected |
| Ctrl+A / ⌘A | Select all |
Canvas Navigation
| Scroll | Pan up/down |
| Shift+Scroll | Pan left/right |
| Ctrl+Scroll / ⌘Scroll | Zoom in/out |
| Ctrl+0 / ⌘0 | Zoom to fit |
| Ctrl+= / ⌘= | Zoom in |
| Ctrl+- / ⌘- | Zoom out |
| Ctrl+Shift+C / ⌘⇧C | Center all nodes |
Panels
| Ctrl+B / ⌘B | Toggle File Browser |